 That Associated Press story displaying a graph alleged to be part of an Iranian computer simulation of a nuclear explosion — likely leaked by Israel with the intention of reinforcing the media narrative of covert Iranian work on nuclear weapons – raises serious questions about the International Atomic Energy Association’s (IAEA) claim that it has credible evidence of such modeling work by Iran.
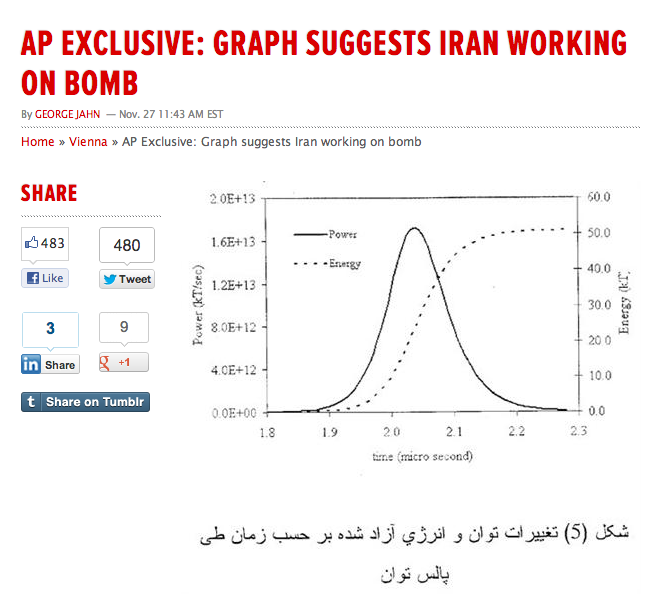
The graph of the relationship between energy and power shown in the AP story has now been revealed to contain absurdly large errors indicating its fraudulence.
Those revelations indicate, in turn, that the IAEA based its publication of detailed allegations of nuclear weapons-related Iranian computer modeling on evidence that should have been rejected as having no credibility.
Former senior IAEA inspector Robert Kelley, who has challenged the accuracy of IAEA reporting on Iran, told Lobe Log in an e-mail that “It’s clear the graph has nothing to do with a nuclear bomb.”
“The pretty, symmetrical bell shaped curve at the bottom is not typical of a nuclear explosion but of some more idealized natural phenomena or mathematical equation,” he said. “Clearly it is a student example of how to perform integrals to which someone has attached some meaningless numbers.”
Nuclear physicists Yousaf Butt and Ferenc Dalnoki-Veress also pointed out that the graph depicted by AP is not only so rudimentary and crude that it could have been done by an undergraduate student, but is based on a fundamental error of mind-numbing proportions.
The graph shown in the AP story plots two curves, one of energy versus time, the other of power output versus time. But Butt and Dalnoki-Veress noted that the two curves are inconsistent. The peak level of power shown in the graph, they said, is nearly a million times too high.
After a quick look at the graph, the head of the Department of Physics and Astronomy at Cal State Sacramento, Dr. Hossein Partovi, observed, “[T]he total energy is more than four orders of magnitude (forty thousand times) smaller than the total integrated power that it must equal!” Essentially, the mismatch between the level of total energy and total power on the graph is “more than four orders of magnitude”, which Partovi explained means that the level of energy is 40,000 times too small in relation to the level of power.
One alert reader of the account of the debunking of the graph at the Mondoweiss blog cited further evidence supporting Kelley’s observation that the graph shown by AP was based on an another graph that had nothing to do with nuclear explosions.
The reader noted that the notation “kT” shown after “energy” on the right hand scale of the graph does not stand for “kilotons” as Jahn suggested, but “Boltzmann constant” (k) multiplied by temperature (T). The unit of tons, on the other hand, is always abbreviated with a lower case “t”, he pointed out, so kilotons would be denoted as “kt”.
The reader also stated that the “kT” product is used in physics as a scaling factor for energy values in molecular-scale systems, such as a microsecond laser pulse.
The evidence thus suggests that someone took a graph related to an entirely different problem and made changes to show a computer simulation of a 50 kiloton explosion. The dotted line on the graph leads the eye directly to the number 50 on the right-hand energy scale, which would lead most viewers to believe that it is the result of modeling a 50 kiloton nuclear explosion.
The graph was obviously not done by a real Iranian scientist — much less someone working in a top secret nuclear weapons research program — but by an amateur trying to simulate a graph that would be viewed, at least by non-specialists, as something a scientist might have drawn.
Although AP reporter George Jahn wrote that officials who provided the diagram did so “only on condition that they and their country not be named”, the country behind the graph is not much of a mystery.
Blogger Richard Silverstein has reported that a “highly-placed Israeli source” told him the diagram “was stolen by the Mossad from an Iranian computer” using one of the various malware programs deployed against Iran.
Whether one chooses to rely on Silverstein’s reporting or not, it is clear that the graph is part of a longer stream of suspicious documents supposedly obtained by Israeli intelligence from inside Iran’s nuclear program and then given to the IAEA over the past few years.
Former IAEA Secretary General Mohammed ElBaradei refers in his memoirs to documents provided by Israel in 2009 “purportedly showing that Iran had continued with nuclear weapons studies until at least 2007.” ElBaradei adds that the Agency’s “technical experts” had “raised numerous questions about the documents’ authenticity”, and suggested that US intelligence “did not buy the “evidence” put forward by Israel” in its 2007 National Intelligence Estimate.
Jahn’s story indicates that this and similar graphs were the basis for the IAEA’s publishing charges by two unnamed states that Iran had done computer modeling that the agency said could only have been about nuclear weapons.
Jahn cites a “senior diplomat who is considered neutral on the issue” as confirming that the graph accompanying his story was one of “a series of Iranian computer-generated models provided to the IAEA by the intelligences services of member nations.”
Those “computer generated models” were discussed in the November 2011 report, which referred to “[i]nformation provided to the Agency by two Member States relating to modelling [sic] studies alleged to have been conducted in 2008 and 2009 by Iran….” The unnamed member states were alleging that the Iranian studies “involved the modelling [sic] of spherical geometries, consisting of components of the core of an HEU nuclear device subjected to shock compression, for their neutronic behaviour at high density, and a determination of the subsequent nuclear explosive yield.”
Nothing in that description of the alleged modeling is documented by the type of graph shown by the AP story.
The IAEA report concludes by saying, “The information also identifies models said to have been used in those studies and the results of these calculations, which the Agency has seen.”
In other words, the only evidence that the IAEA had actually seen was the graphs of the alleged computer modeling, of which the graph shown in the AP story is alleged to be an example. But the fact that data on that graph has been credibly shown to be off by four orders of magnitude suggests that the Israeli claim of Iranian computer modeling of “components of the core of an HEU nuclear device subjected to shock compression” was completely fabricated.
Former IAEA Inspector Kelley also told Lobe Log that “We can only hope that the claim that the IAEA has relied on this crude hoax is false. Otherwise their credibility has been shattered.”
– Gareth Porter, an investigative historian and journalist specialising in U.S. national security policy, received the UK-based Gellhorn Prize for journalism for 2011 for articles on the U.S. war in Afghanistan.


The whole case against Iran is concocted by the US and Israelis based on nothing but HOAX
Modelling is UK English.
Rumsfeld “smelled” Weapons of Mass Destruction in Iraq and made that as a phony excuse to pound the country. Now the American Hawks want an excuse to attack Iran. If they want another graveyear after Afghanistan and FATA, we can only wish them luck. Iran is different nut to crack than Iraq. And dont forget, even Afganistan has not been conquered andnever will be. These are very resilient people and the Americans cant even dream of living in the conditions these people can survive happily.
Funny how these forgeries keep coming up, always supporting Israel’s political positions, or Israeli propagnanda. We had the forged yellow cake papers purporting a Iraqi order for yellow cake from Niger, the infamous ‘laptop’ supposedly show nuclear weapon designs, and several more recently purporting to show Iran is working on a nuclear bomb. You would think Mossad could do a better job.
Since his selection in 2008, Obama has been engaged in a vicious cycle against nation of Iran to take America with its borken economy into a stupid war to serve his master, Israel Lobby, where put him at the WH.